Furthering Public Knowledge by Visualizing Digital Archives
Theme 1: Visualizing Actors, Ideas and Places
Building on powerful digital analysis tools, such as histograph, this project aims to reveal the manifold relations between digital collections of texts, images, audio and video documents.
Overview
Mapping historical events and contextualizing them is often a challenging task, particularly when facing a large number of archival documents. While technology will not replace the valuable work of researchers and scholars, it nonetheless has the potential to help and facilitate the quest for knowledge and for better understanding our past.
Understanding our past requires us to explore the content of historical documents and artifacts, notably if living sources, such as individuals or institutions, are no longer available for research purposes. These documents contain layers of information, ranging from relationship between key actors, but also insights on ideas, concepts and broader theoretical knowledge that is sometimes hidden in plain sight. Making sense of these different layers and links between different entities is crucial to capturing historical turning points and explaining complex issues to a wider audience, including decision-makers, scholars and society at large.
This multi-disciplinary, international project draws on powerful digital analysis tools based on an open source platform called histograph, which supports research on large data sets of multimedia files. The software is capable of linking automatic annotation to the collaborative work of crowds, such as research collaborations, and uses graphs to display relations between documents. It combines tools for the automatic detection of named entities, such as people, places, institutions and dates and was created by an earlier European Union-funded research project CUbRIKfind new pathways for the combination of human and machine computation in multimedia search.
What's New?
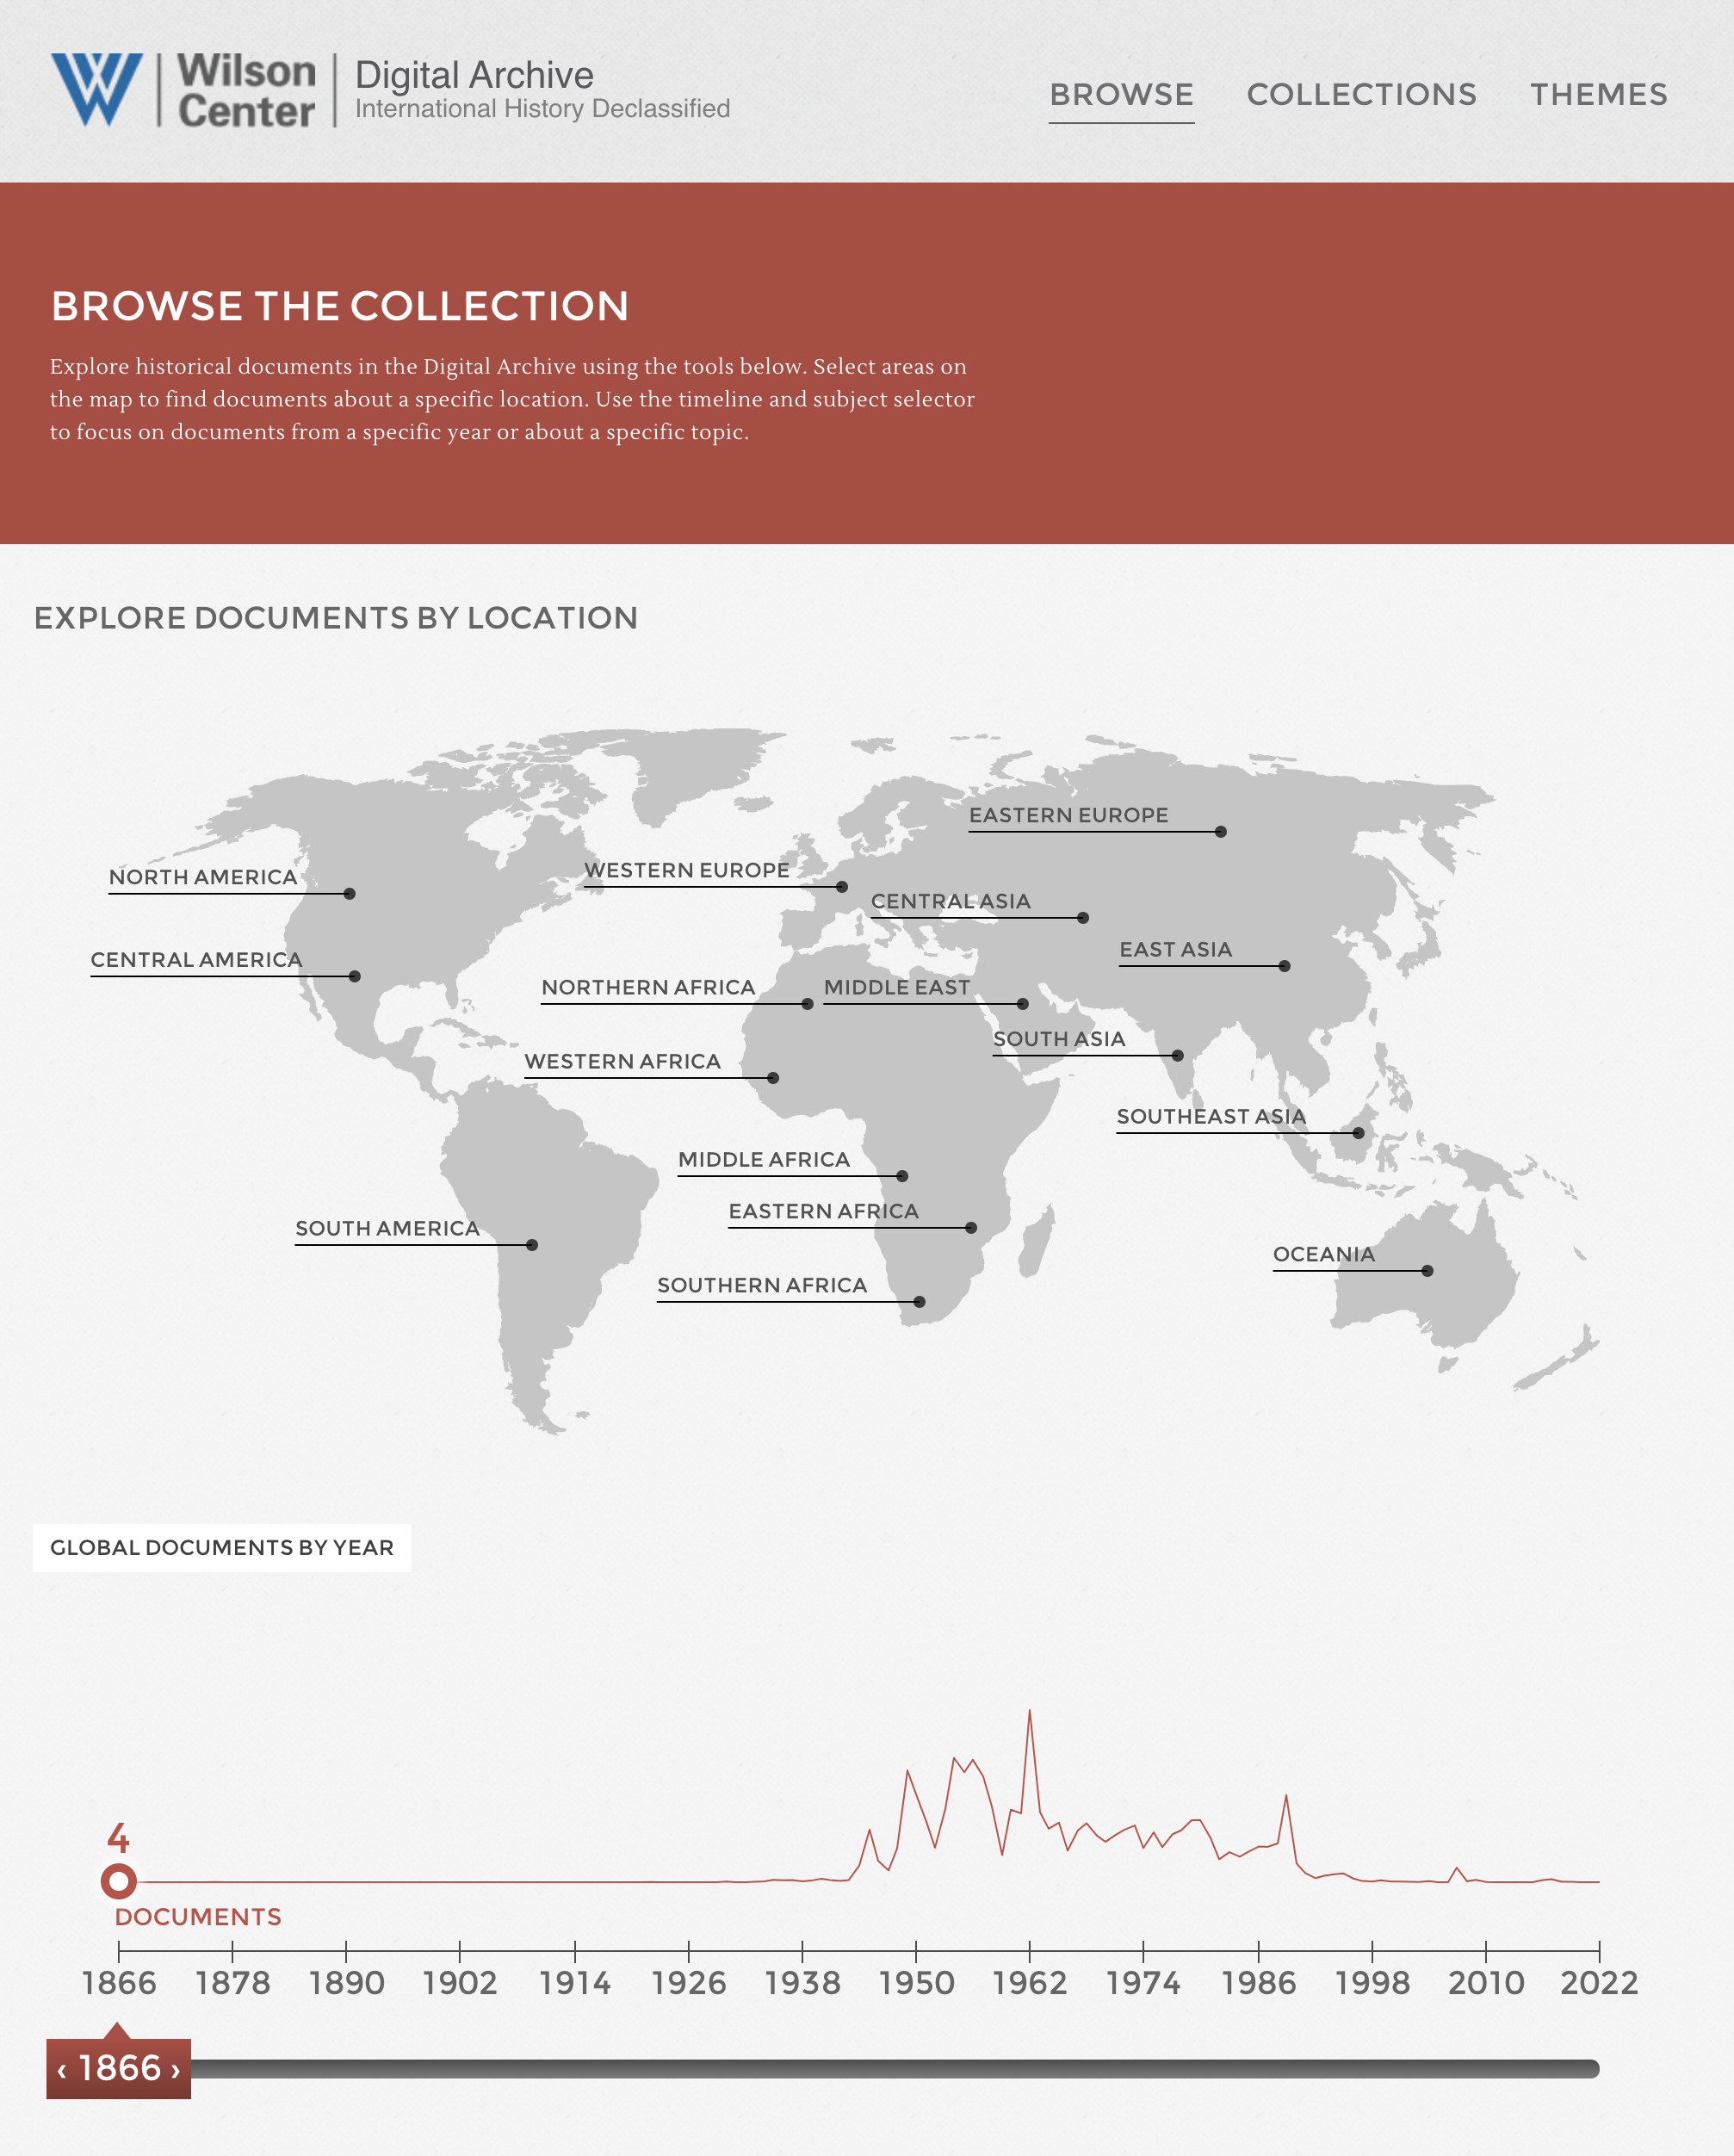
The new platform will render the Wilson Center’s Digital Archive more dynamic, allowing researchers and the public to access the collections more intuitively and cohesively by letting visitors explore a variety of relationships in the available online data. How exactly does it work? Let’s first look at the present Digital Archive functionality. Currently, the database only allows visitors to browse different collections across time, across a variety of geographic locations and by key search terms. Unfortunately, it is not possible to analyze and assess the data more dynamically based on different relationships between keywords or concepts, individuals and locations.
Here is a quick overview of how to navigate the existing archive. Click on any image below to get a brief description of how to browse the current collection and understand how to access document sets. You may also access the Center’s collection directly, browsing the collection freely.
You can choose a particular region on the world map. You can also limit your search to a specific time period.
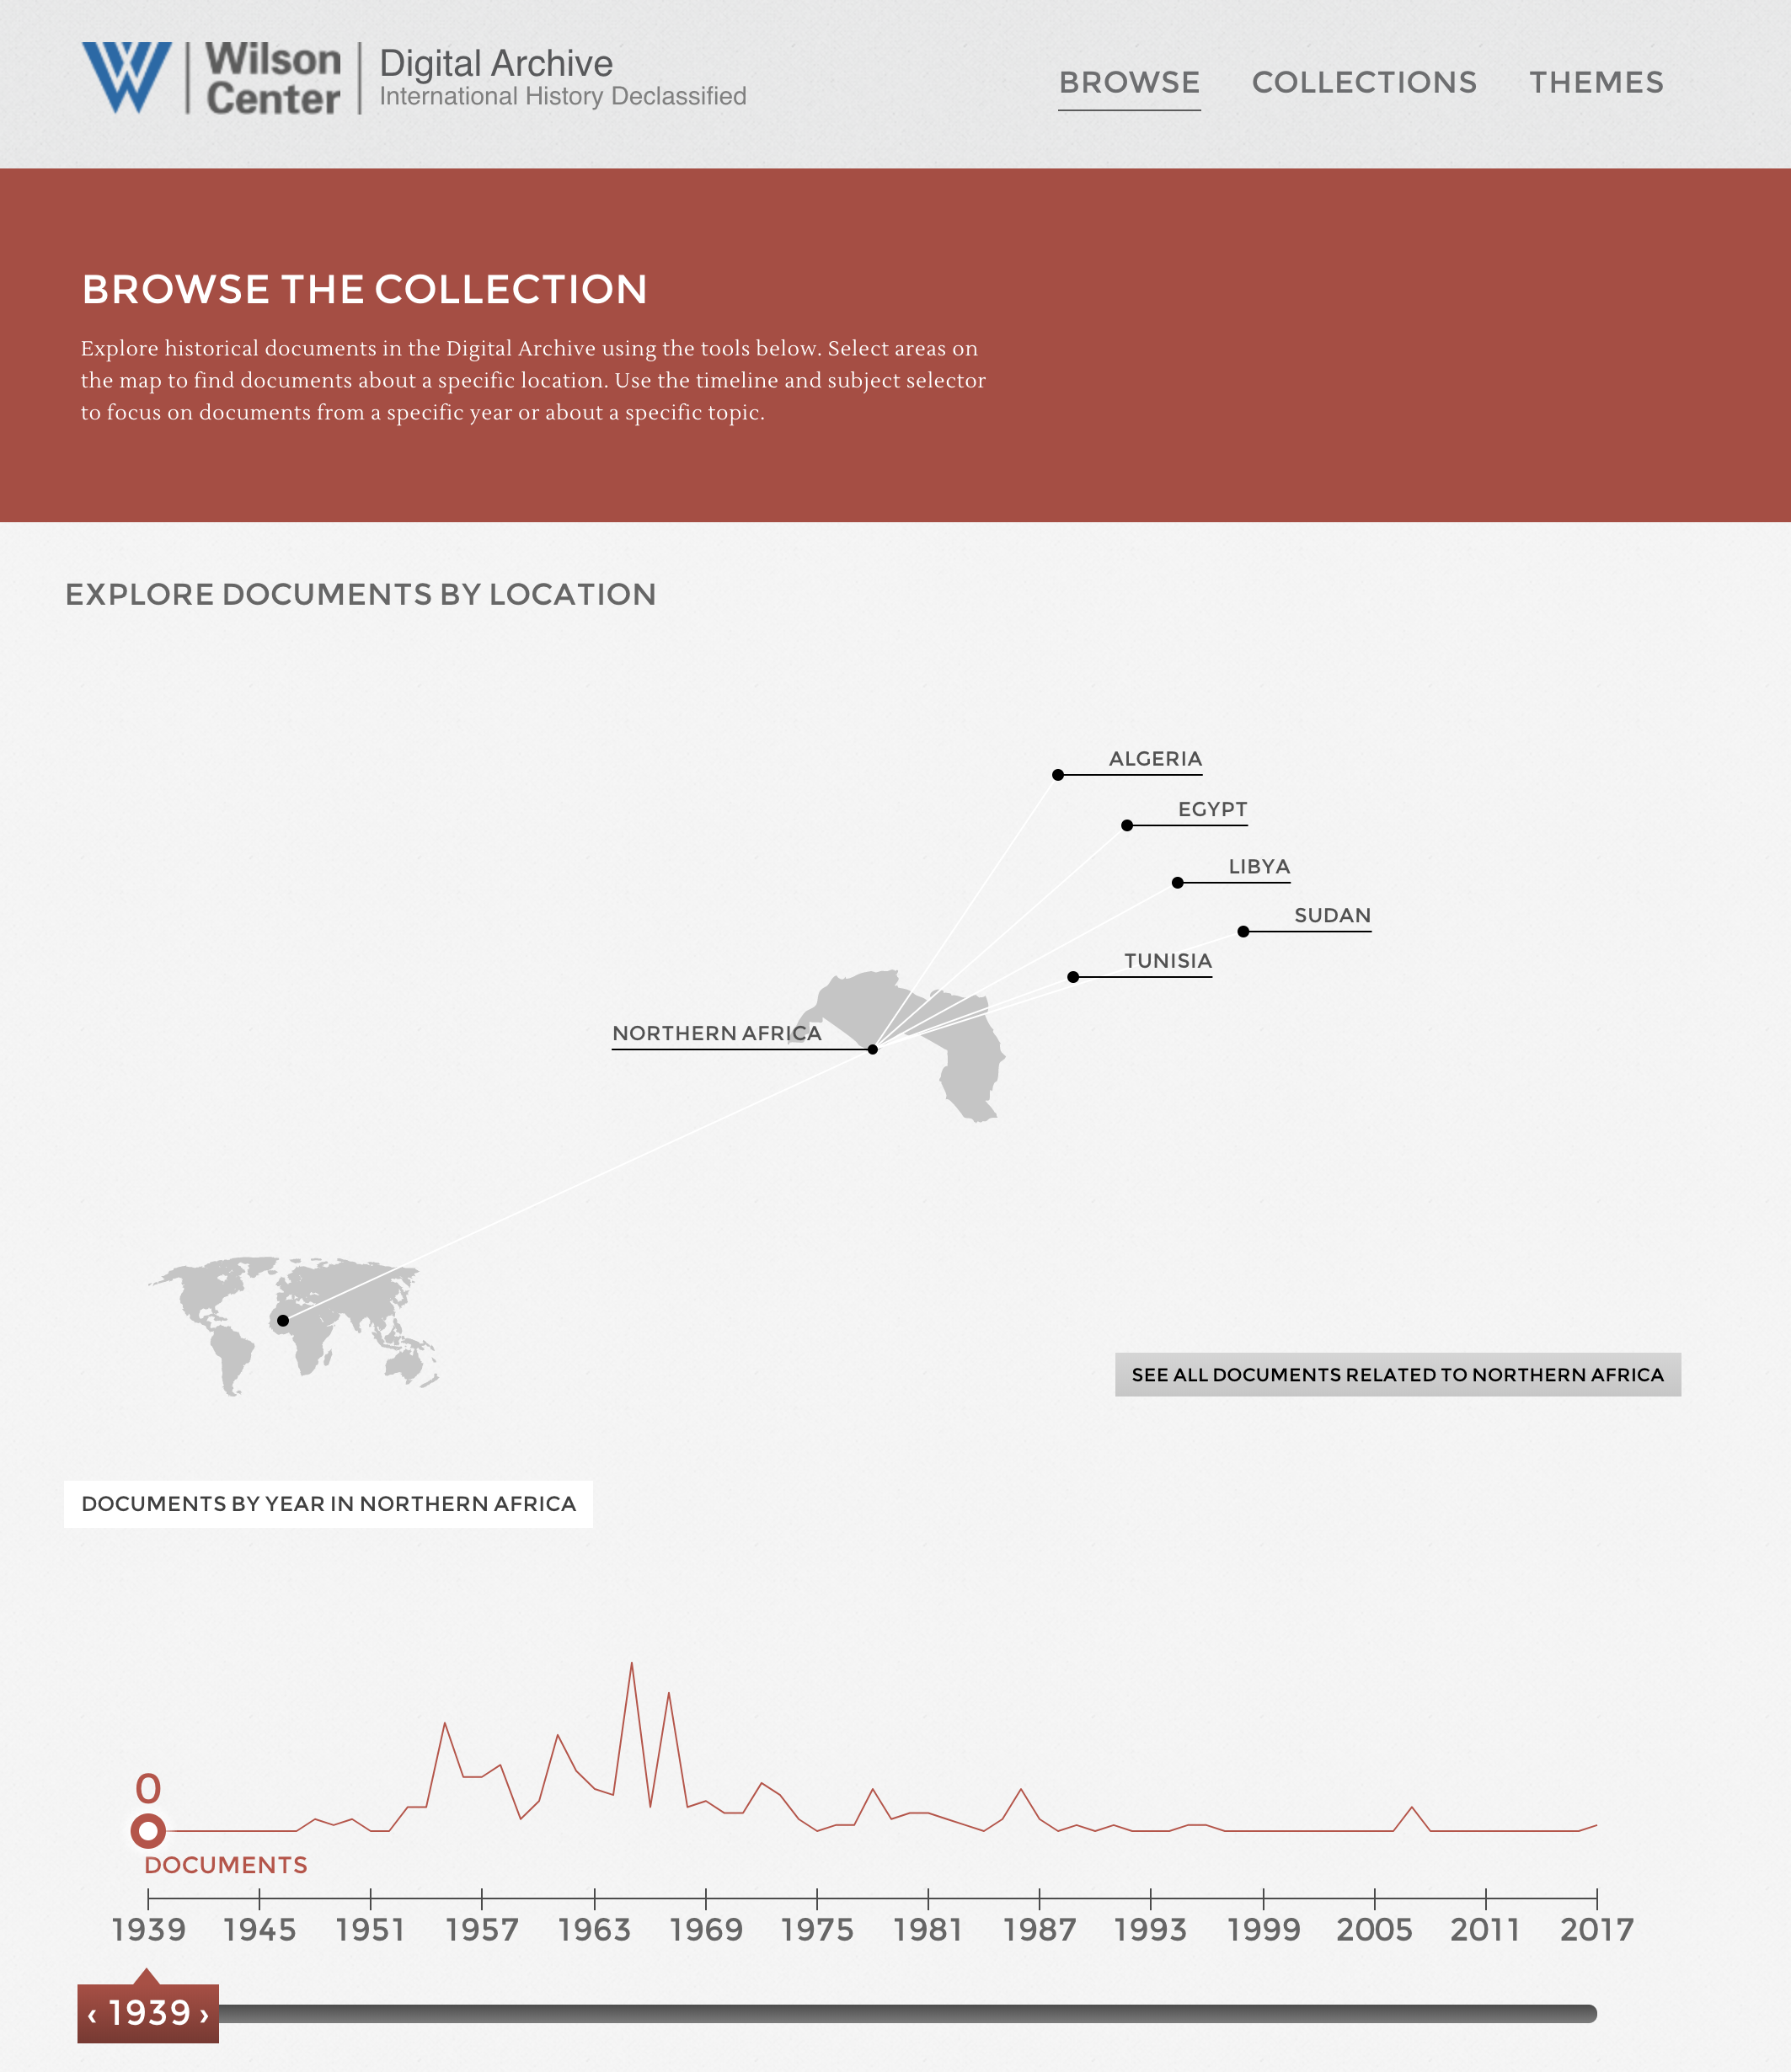
Next, you can zoom in by selecting a specific country within your regional choice.
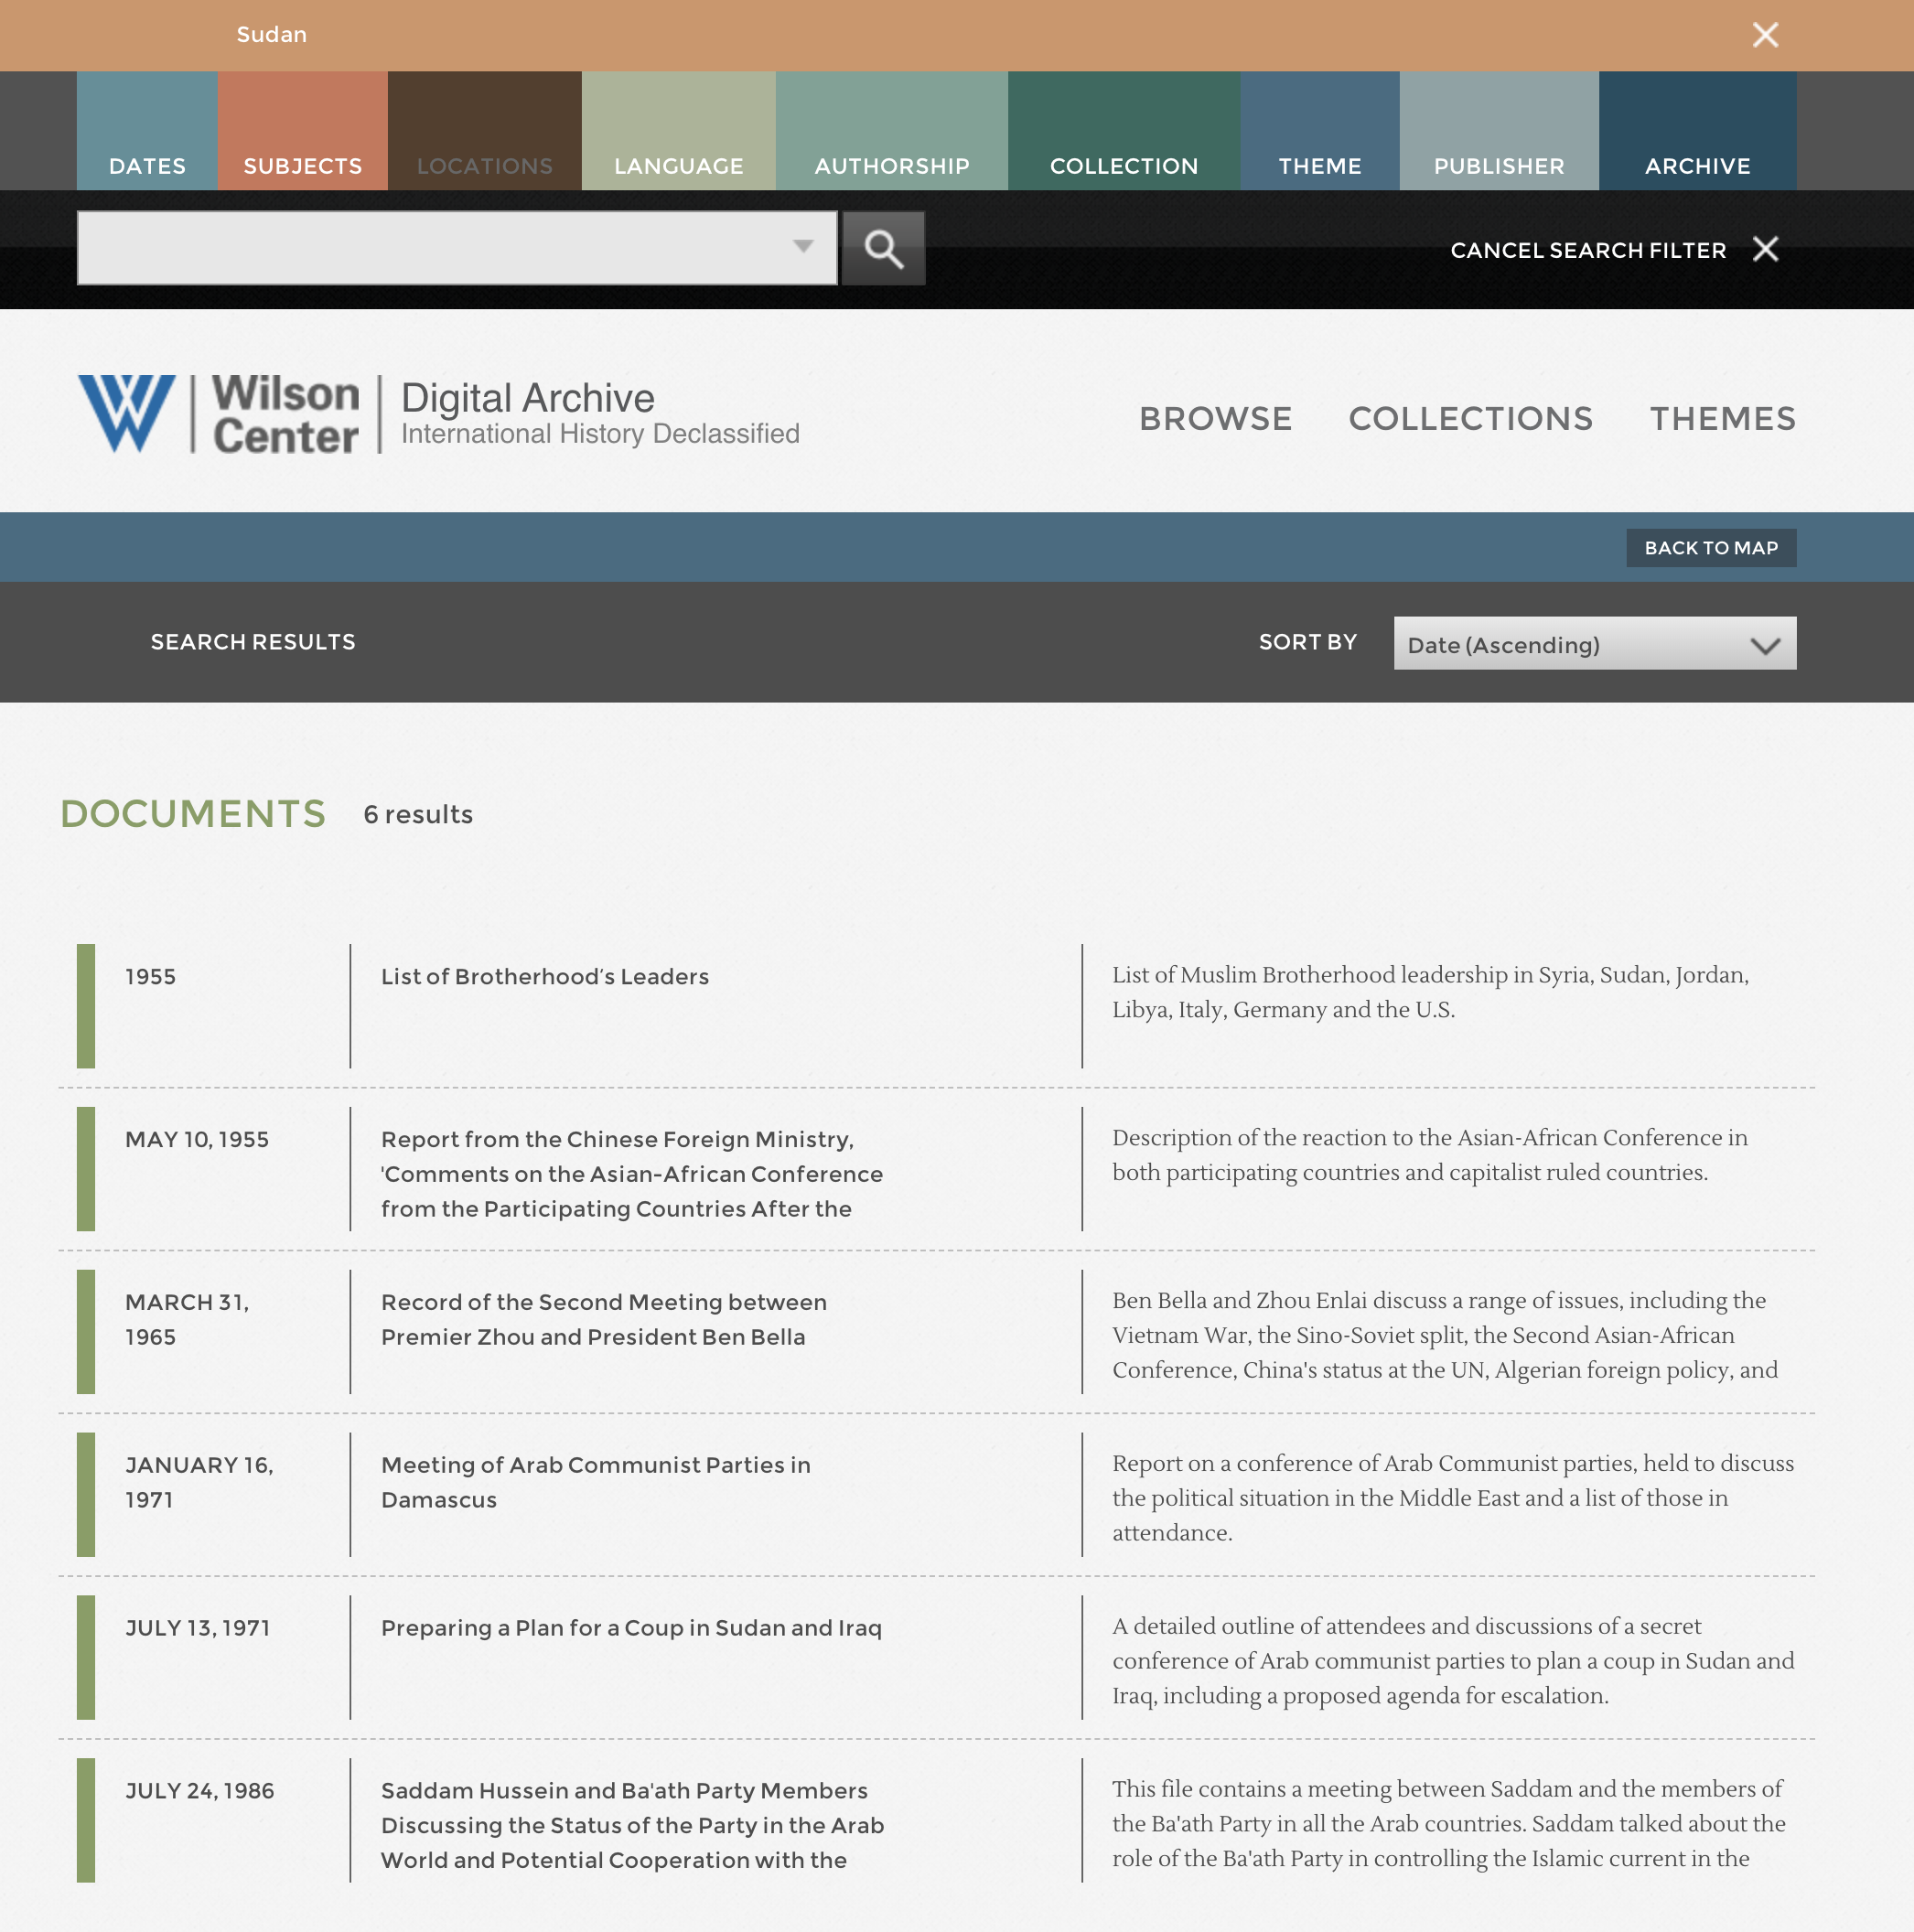
The database will then provide you with a final set of document for your search. You can then access those individually.
The Exploratory Power of histograph
The project aims at expanding these limited exploratory functionalities. Initially, the end user will be able to choose between a gallery view or graph view.
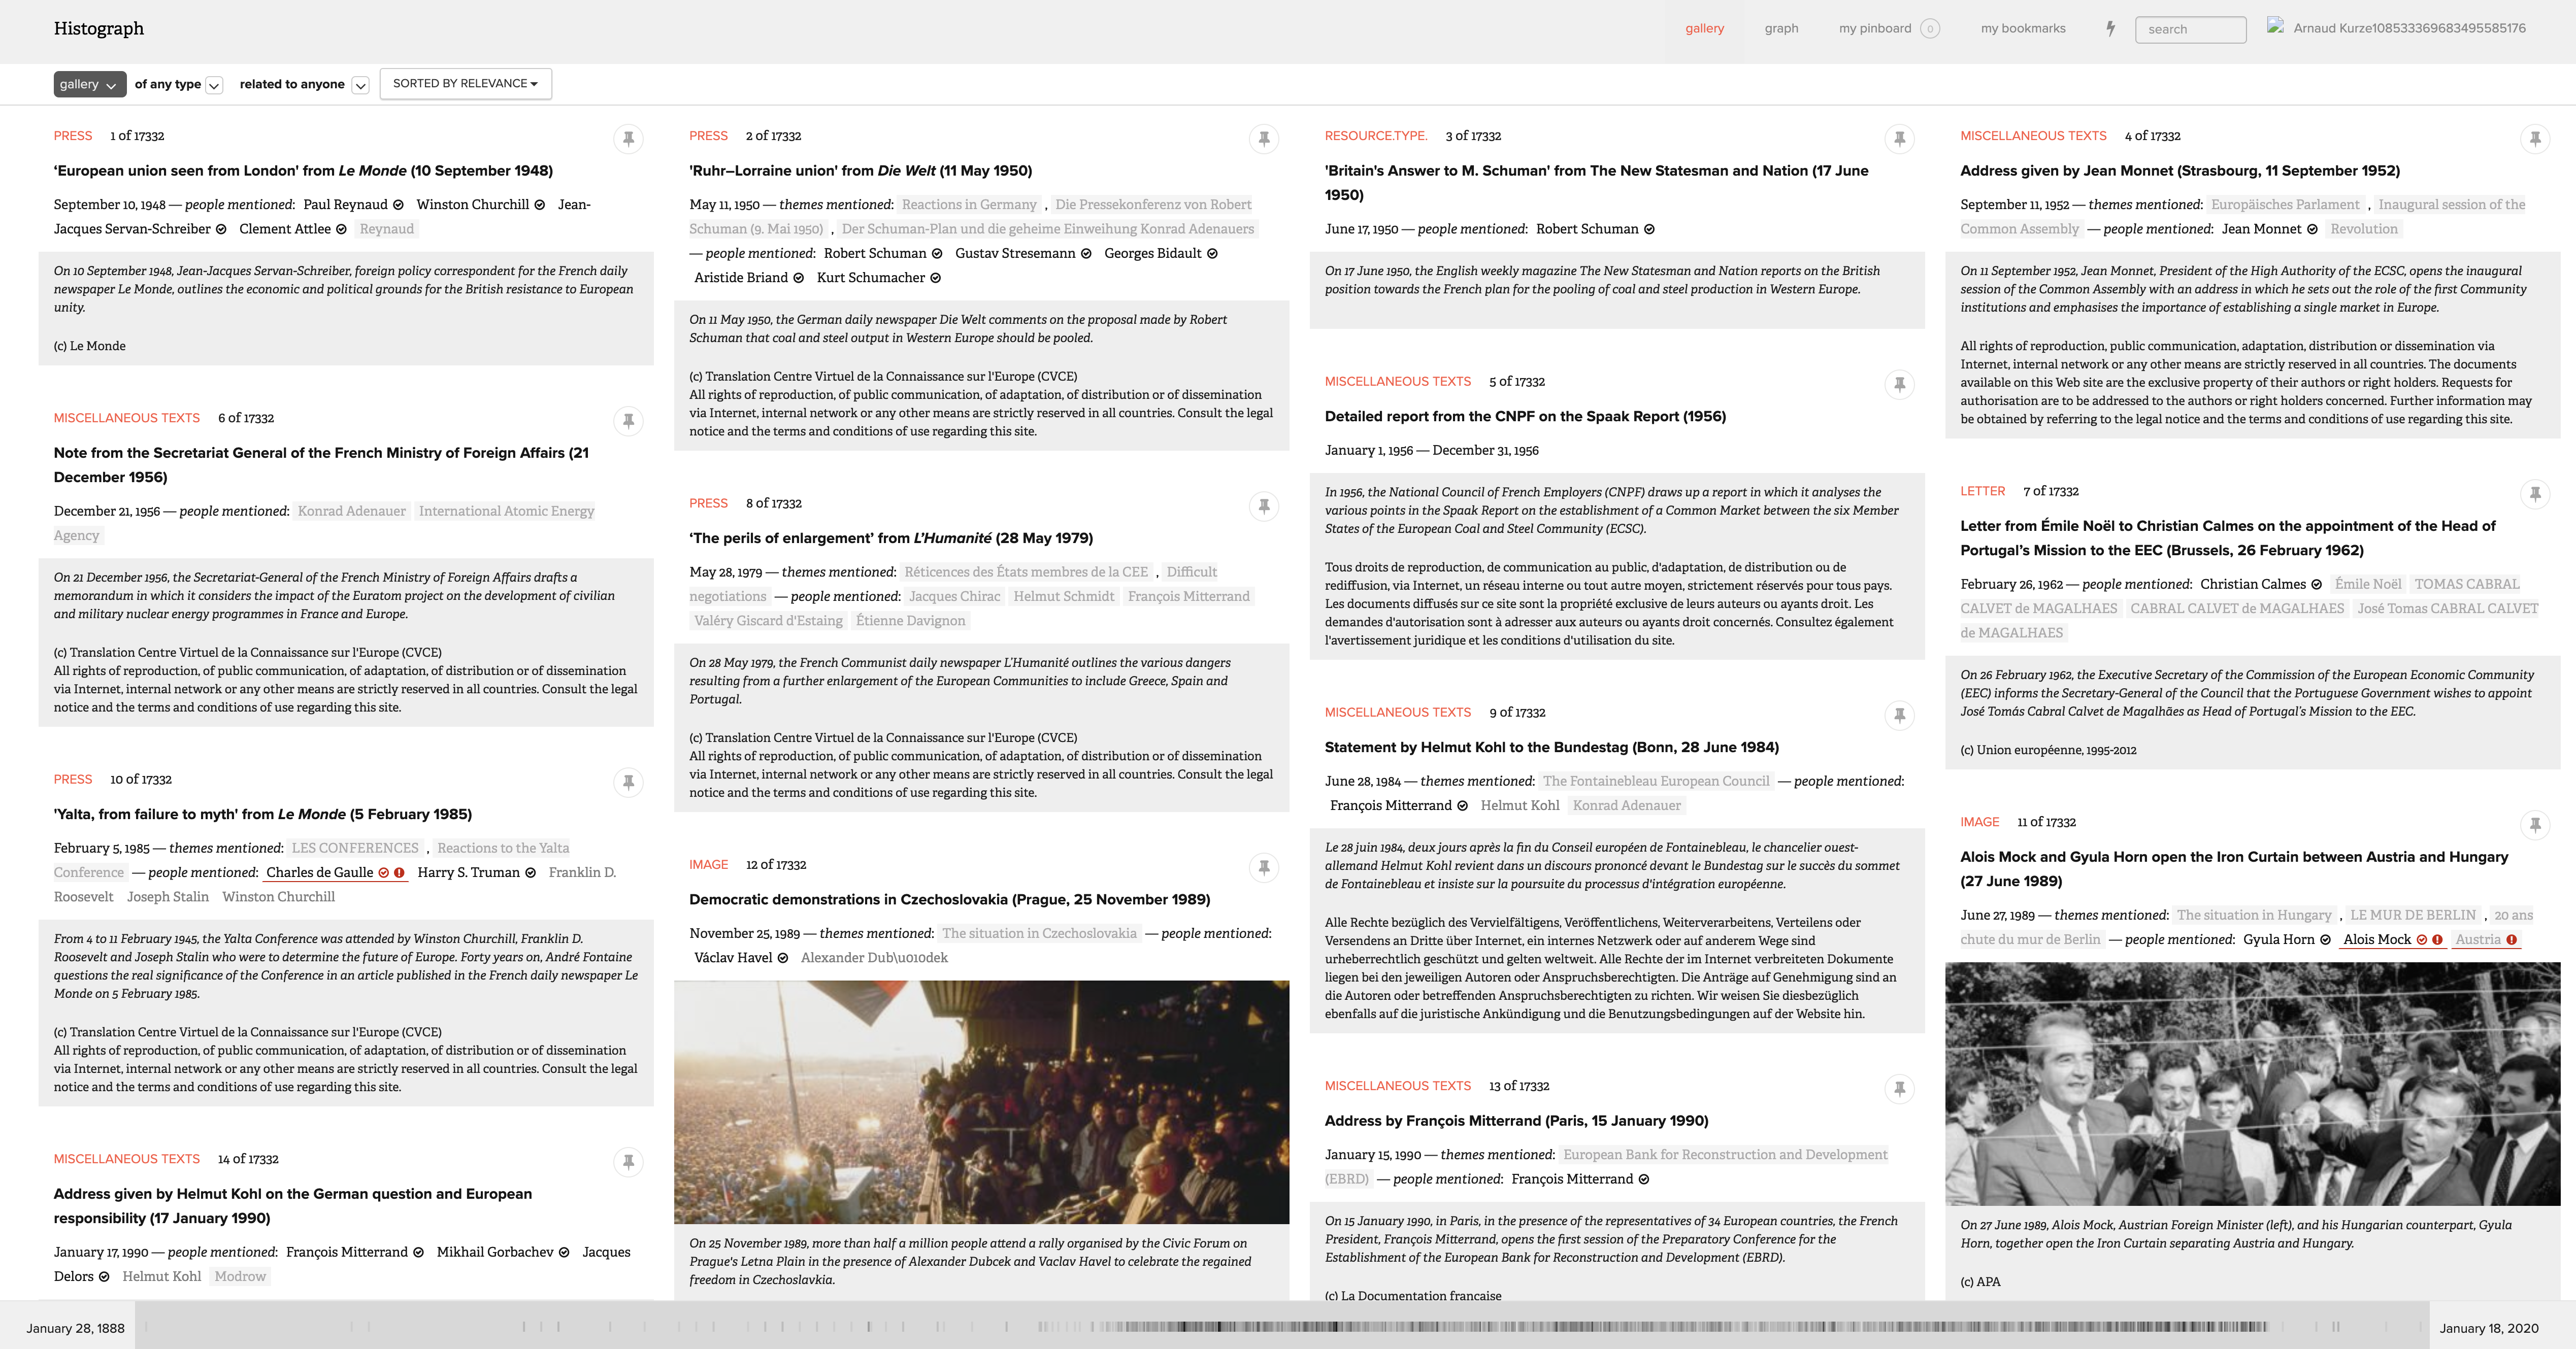
Gallery view.
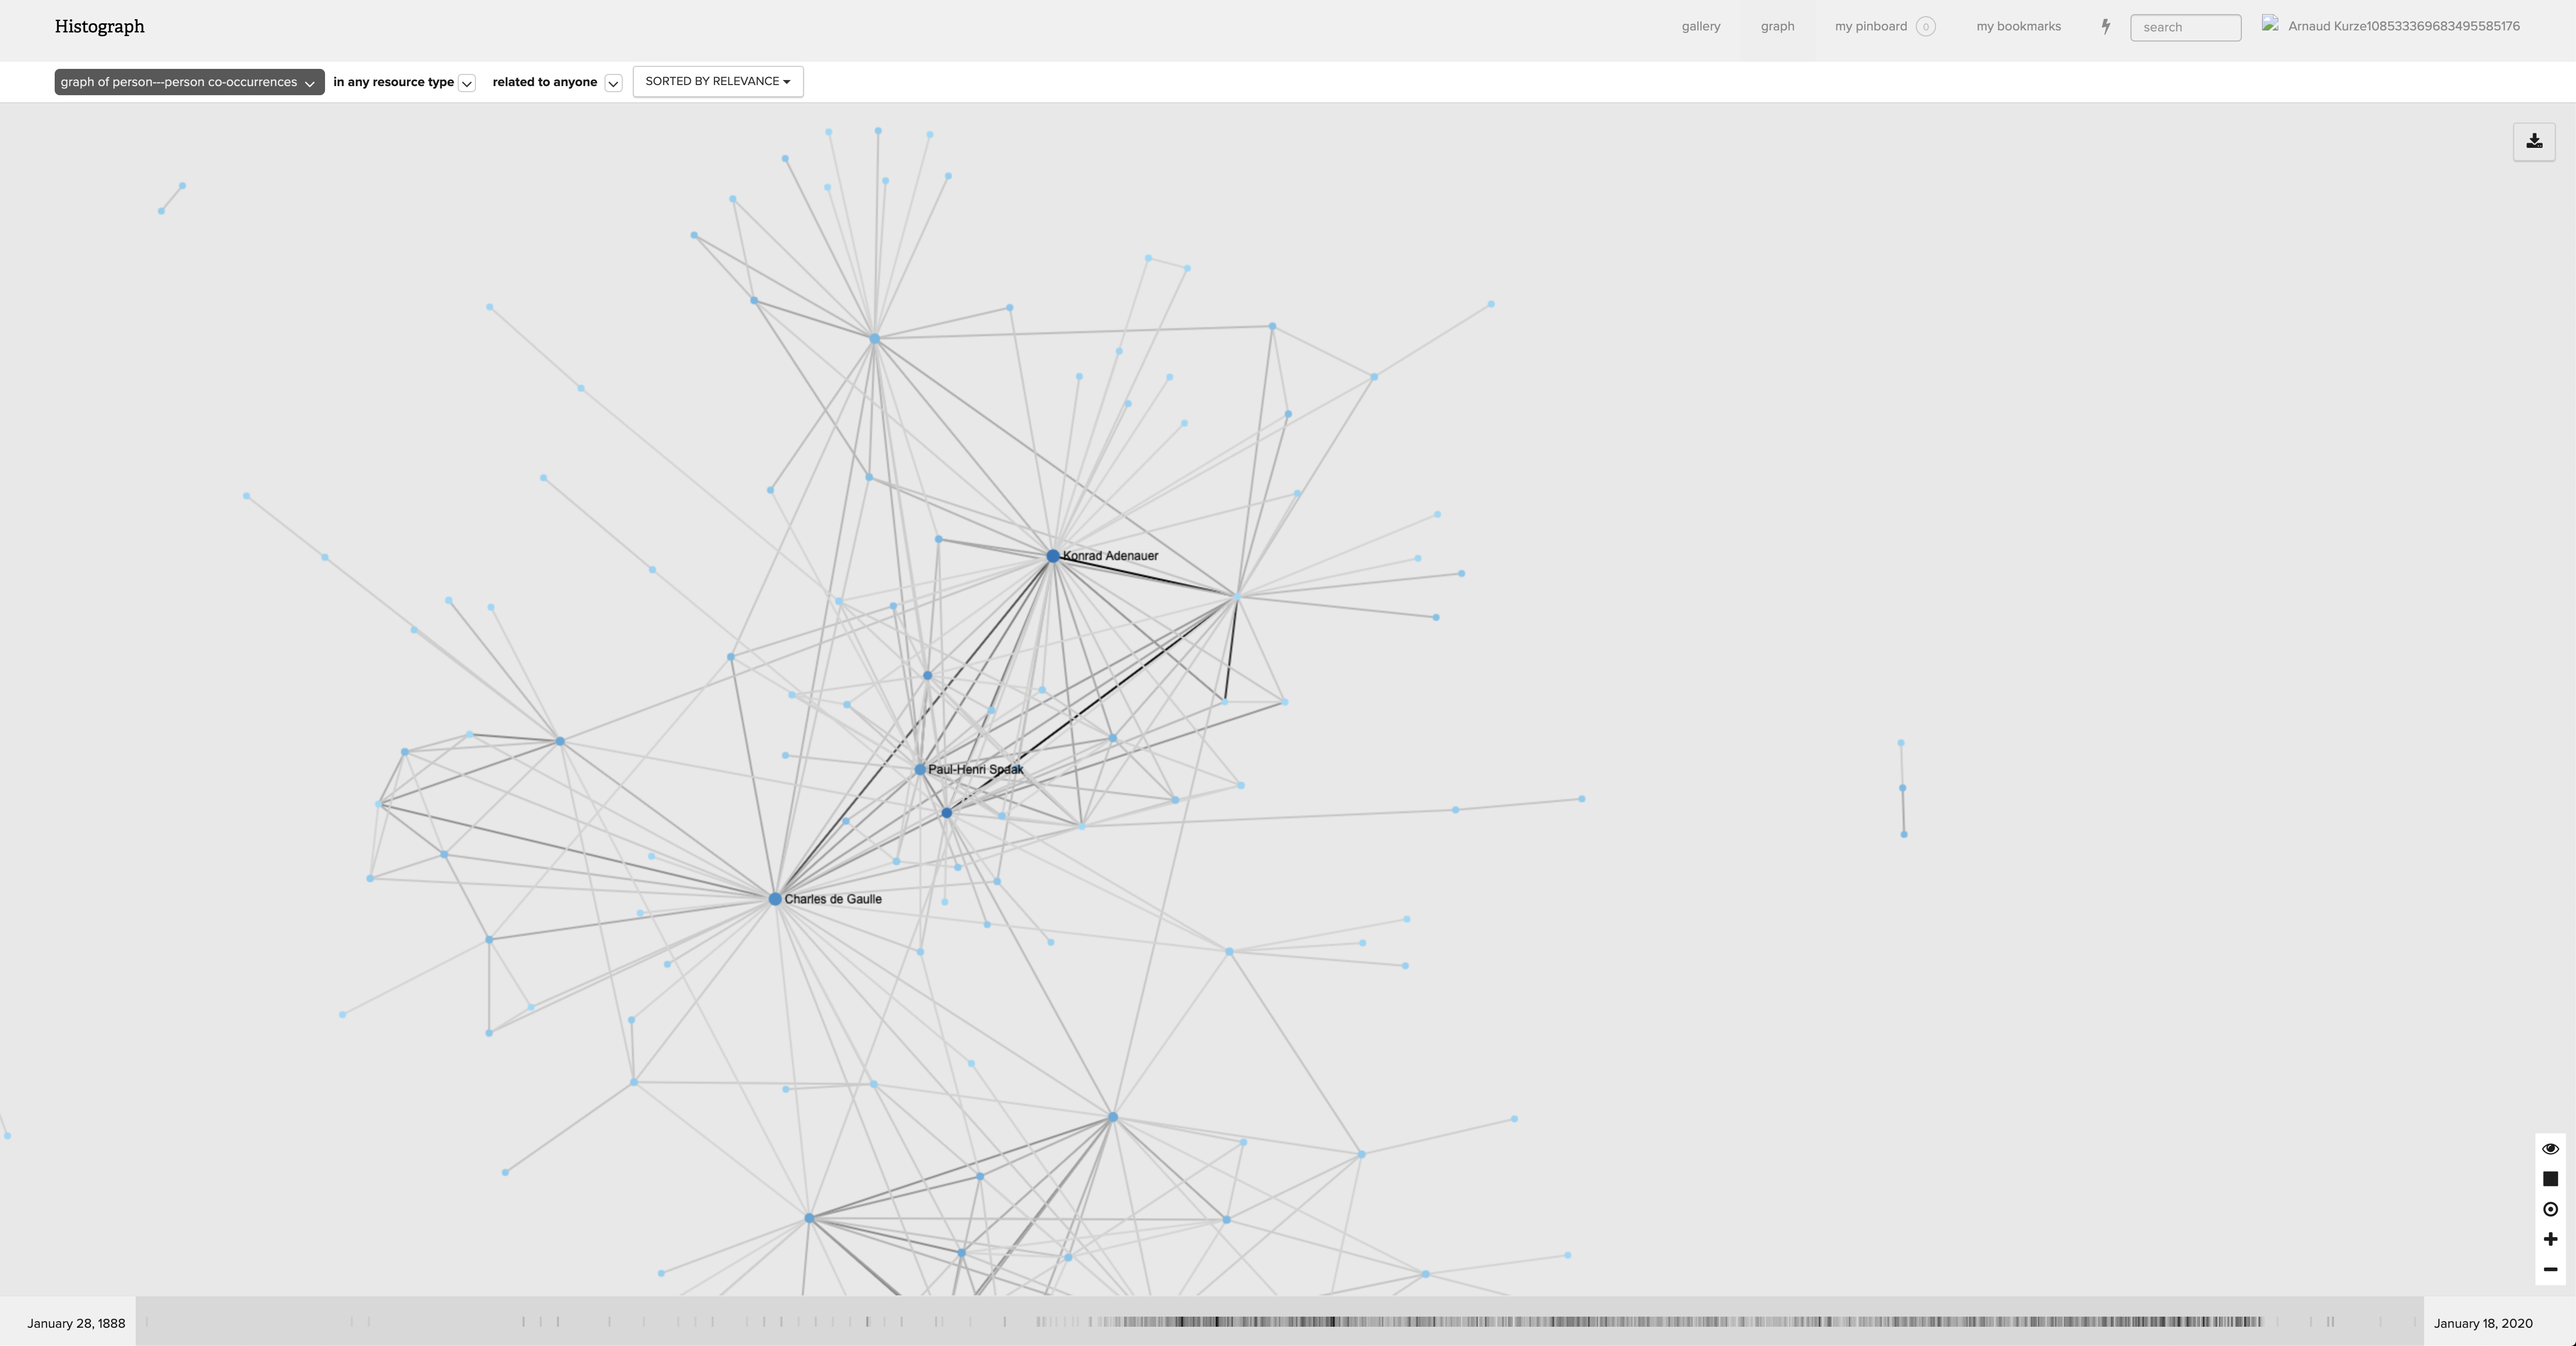
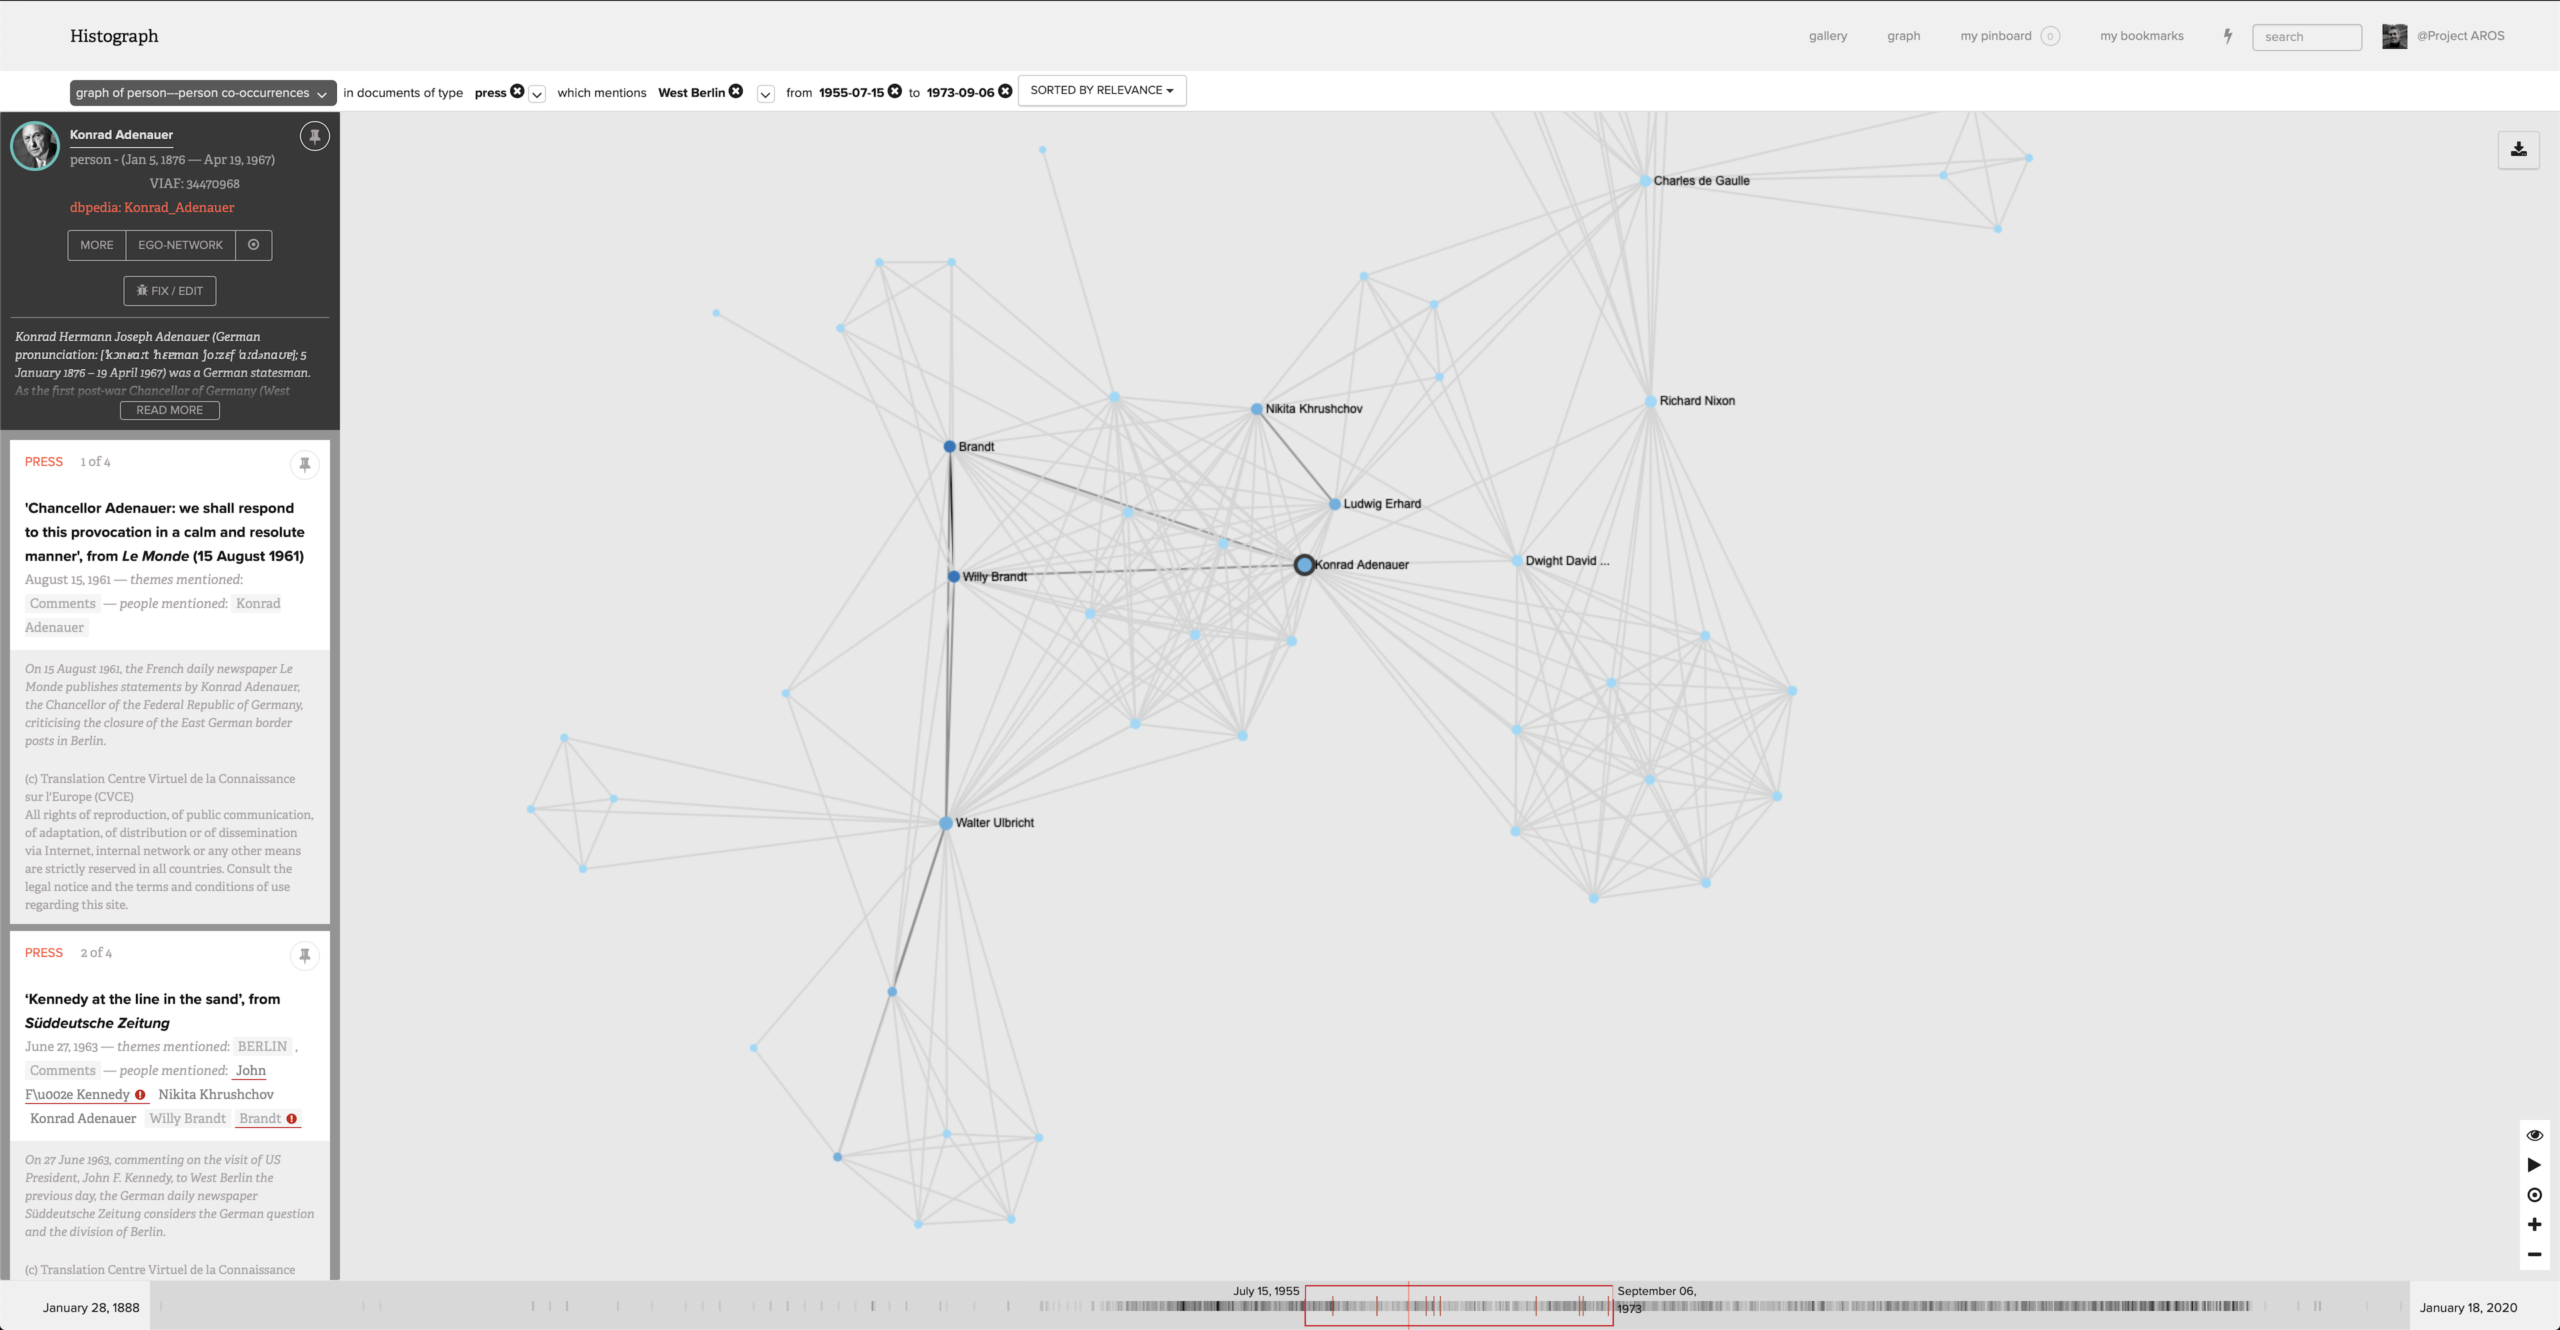
Graph view.
While the gallery view allows the user to browse the document selections easily with basic information, such as source, keywords and other summary information, the graph view allows the user to explore relationships between different contents contained in the documents.
How does histograph work?
The exploratory power of the platform is available in an early version of histograph, which maps documents related to the European Union integration process. It also provides a tutorial for new users. For the current project, we have created a short video that highlights the exploratory power of the updated version of histograph.
If you would like to see the tool in action, we encourage you to test the demo version of the early version of histograph.
You may use your own login credentials or, alternatively, you may use the pilot test account (twitter) with the following details:
Username: arosproject
Password: WashingtonDC2019
Screenshot of histograph tool based on European Union integration archival material