Histograph was created under an open source license by Luxembourg Centre for Contemporary and Digital History (C2DH) and is available on github. In a nutshell, it links automatic annotation to the collaborative work of crowds and uses graphs to display relations between documents. It also combines tools for the automatic detection of named entities (people, places, institutions and dates) and was initially developed to find new pathways for the combination of human and machine computation in multimedia search.
A Look Under the Hood
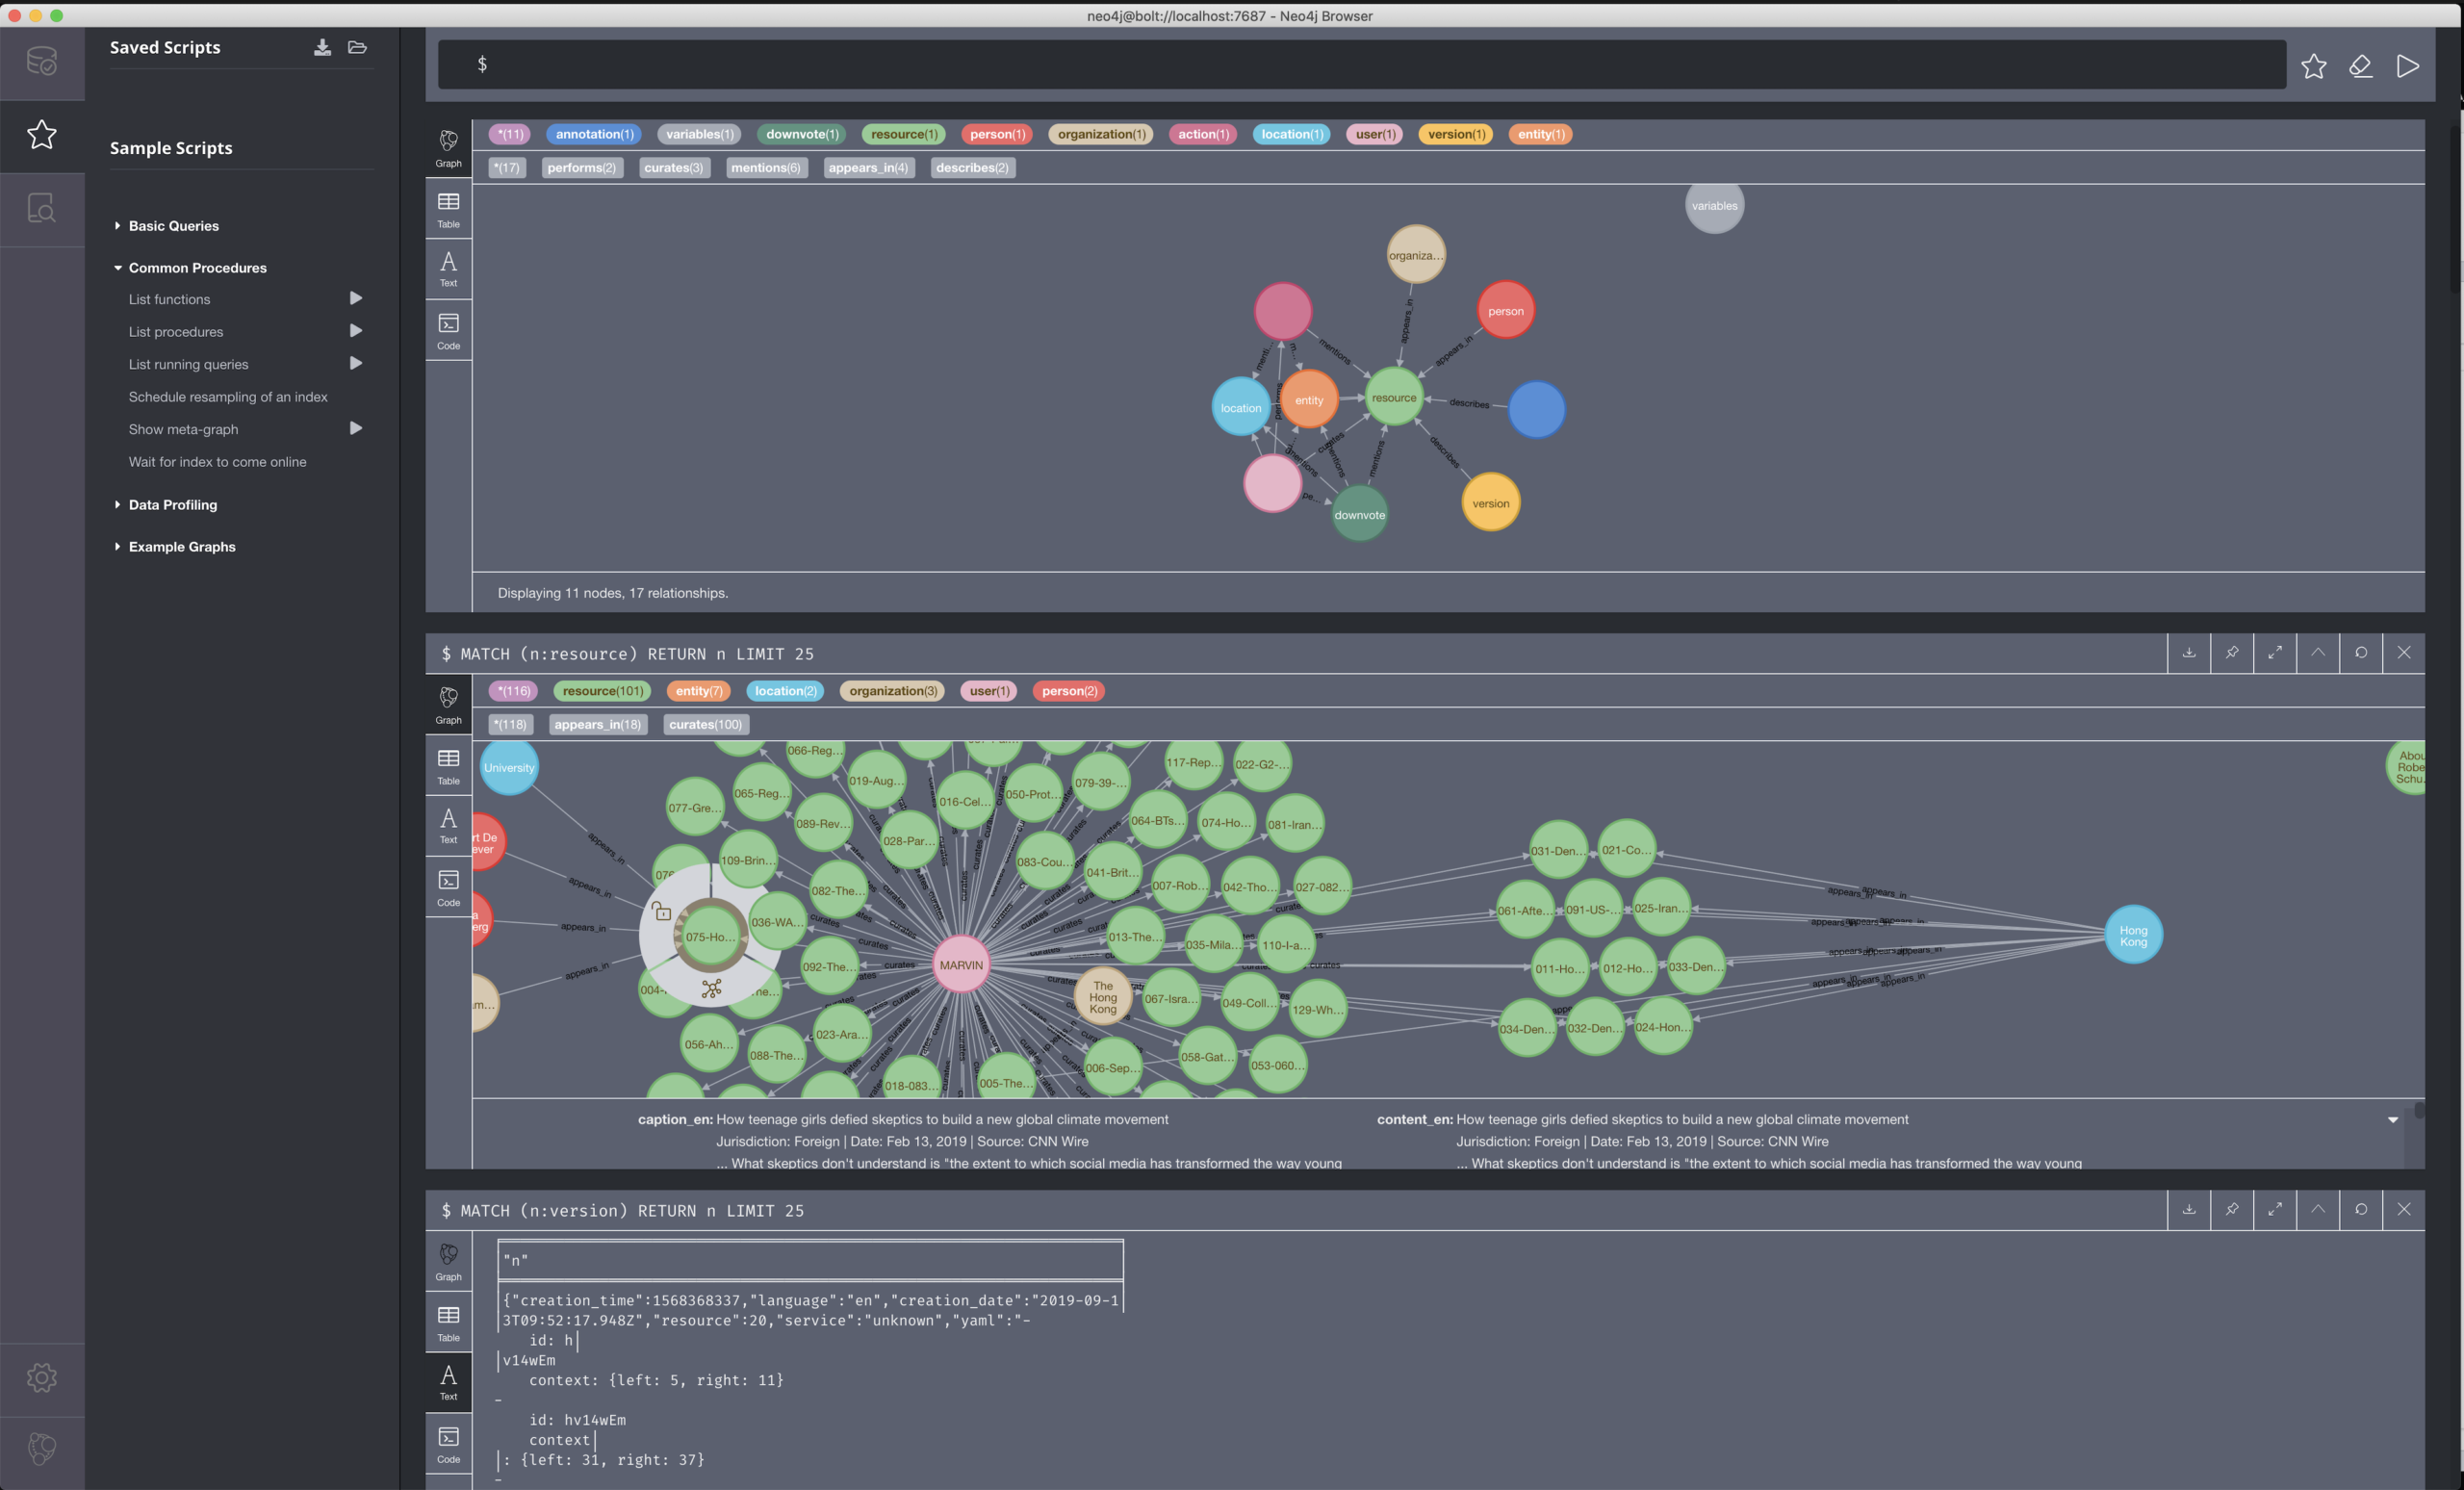
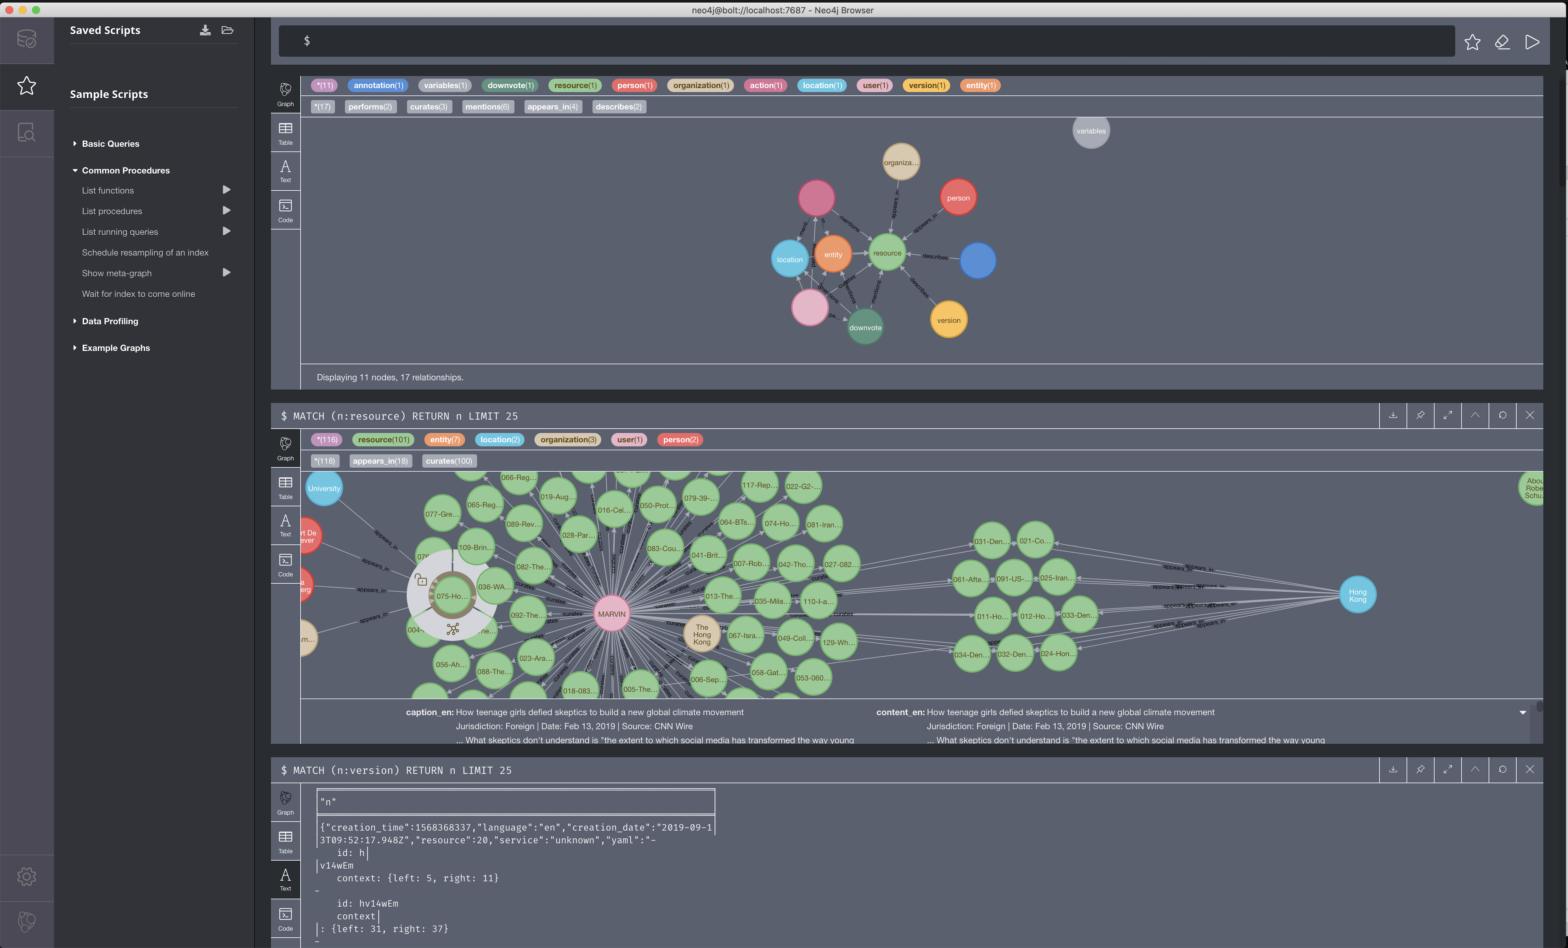
The screenshot below illustrates the Neo4j database platform, a tool that helps histograph visualize relationships between entities.

Study of 21st Century Social Movement Protest in the Media
The above screenshot is a snapshot of sample content retrieved from digital media archives — major Anglo-Saxon newspapers — documenting contemporary social movement protests, such as recent coverage of Hong Kong protests and contentious politics in the Middle East and North Africa region after the Arab Spring.
Green nodes represent a selection of archival documents, identifiable by a specific reference number, and which also contain additional, rich meta data for further analysis. Differently colored nodes are representative of a variety of entities, such as persons, locations and concepts.
Links between each document (i.e. connections between green nodes), indicate co-occurrences of specific values within the documents.
To explore how the tools work based on a set of documents and examine a panoply of relationships, please go to the histograph demo version. For a tutorial, please click here.
